From data to results
- Nov 25, 2025
- 6 min read
After conducting my first experiment, I’ve spent a lot of time working with my data and building up my skills in data analysis. I want to run the right statistical tests and understand what my results are telling me. I admit I wasn’t prepared for how much time this stage would take. But the learning curve is steep, and I know that when I run my second experiment, the whole process will feel much easier.
I’m excited to learn everything I can about data analysis and find out whether the magnetic field has had any effect on the plants. But how can I, or any other scientist, tell whether they’ve found something meaningful? And why is it that, in so many fields, expertise grows not just from knowledge but from planning, conducting, and analyzing experiments?

Measuring the variables – the core of every experiment
When scientists conduct experiments, they want to know whether a certain factor influences what they’re studying. For example: Did the magnetic field affect seed germination or not? But how do we determine that?
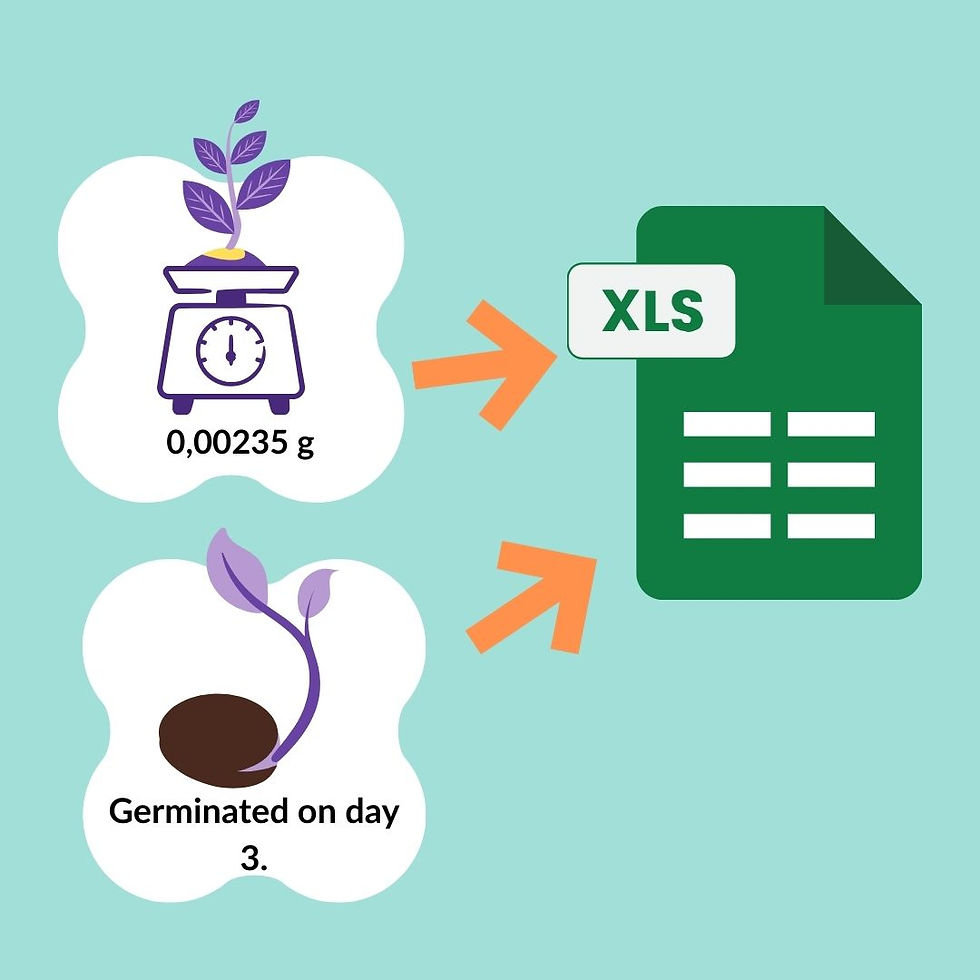
In an experiment, researchers collect measurements on specific variables. In my case, that meant recording how many seeds germinated each day and measuring the weights of seedlings at a certain age.
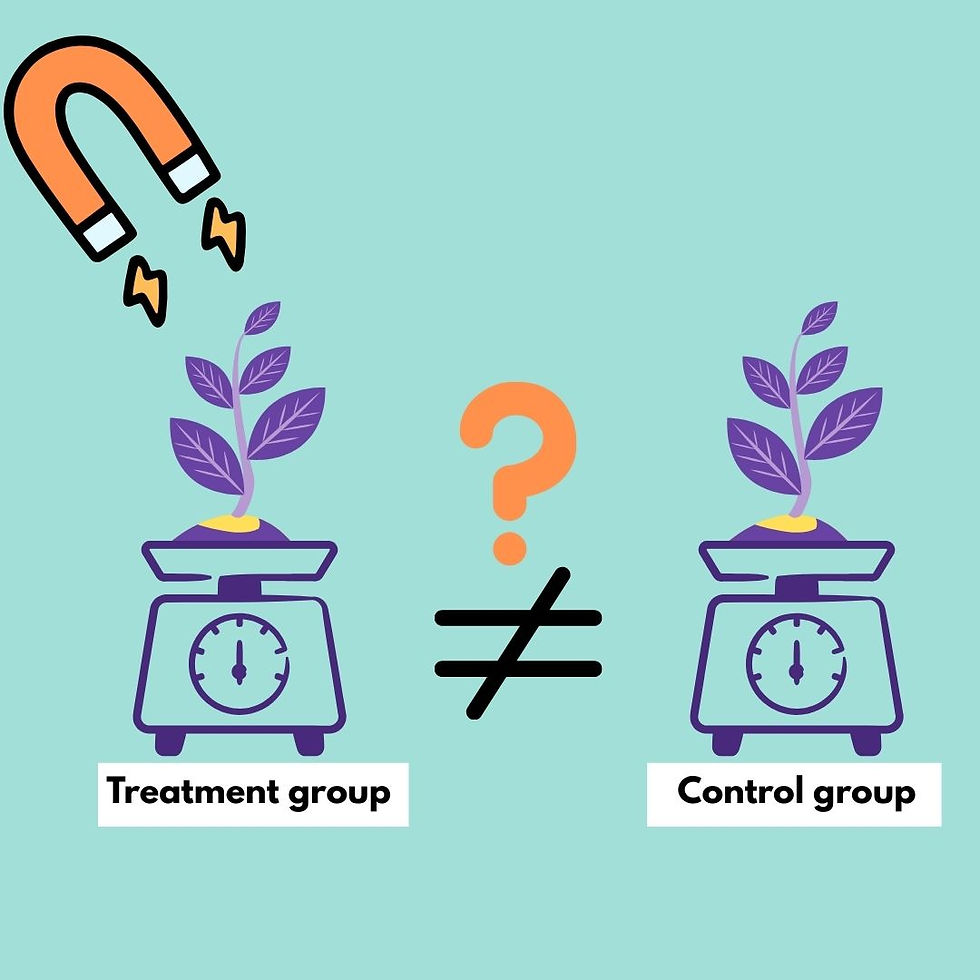
I want to know whether these variables differ between seeds exposed to a magnetic field and those in a control group. A control group is essential: it ensures that the only meaningful difference between groups is the factor being tested.
In my experiment, the control seeds experienced the same conditions as the exposed seeds, except for the magnetic field. Temperature, light, moisture, and other conditions must be kept as similar as possible, so any differences are likely caused by the magnetic field, not something else. Of course, perfect control is nearly impossible, but thoughtful experimental design helps minimize unintended variation.
The data is collected – what now?
After the experiment, I ended up with a lot of data in Excel: seedling weights, germination days, germination percentages for each petri dish (each containing ten seeds), averages of variables, and more. The big question is: Are the magnetic-field seeds different from the control seeds?
This is where statistical analyses come in. They’re mathematical tools that help us find and evaluate patterns, relationships, and differences in our data — in my case, differences between groups

Understanding variation
What do I mean by group differences? Well, individual plants naturally vary. One seedling might weigh 0.026 g while another weighs 0.03 g. Because of this variation, the summary values for each group, like the mean and standard deviation, also differ.
If the magnetic-field group has an average seedling weight of 0.02 g and the control group averages 0.04 g, is that a real effect? Or just random variation? That’s exactly what statistical tests help us figure out

Hypotheses and significance
When we use statistical tests, we’re essentially asking whether the patterns we observe in our data are larger than we would expect to see by chance alone.
Many common statistical tests do this by comparing the variation we see between groups to the variation within groups, or by evaluating whether the observed data match what we would expect if there were no real effect. Statistical tests help us decide whether what we see in the data is unlikely to be explained by random variation, in which case we call the result statistically significant.
To do this, statistics relies on the idea of hypotheses—assumptions we put to the test:
The null hypothesis (H₀): There’s no real difference between the groups; nothing interesting is going on.
The alternative hypothesis (H₁): There is a real difference.

How p-values help us to evaluate hypotheses
To decide which hypothesis is more believable, we often look at a p-value. A p-value tells us how likely our results (or even more extreme ones) would be if the null hypothesis were true. In other words, it’s a measure of how surprising our results are under the assumption that nothing is actually happening.
Statistical significance is usually judged using a p-value threshold, often 0.05. If the p-value falls below that threshold, the result is considered statistically significant. However, the commonly used 0.05 cutoff is based on tradition rather than any deep scientific truth. Over time, researchers have simply adopted it as a practical, shared benchmark for interpreting results.

Statistical tests aren’t all-knowing
Statistical tests are useful tools, but they don’t deliver absolute truth. They help us evaluate patterns in data, but they come with limitations. To use them well, it’s important to understand both how they work and what their limitations are.
There are many types of statistical tests, each designed for different kinds of data and research questions. Some compare the means of groups, others look for relationships between variables, and some examine probabilities or how data are distributed.
Choosing the right test depends on several factors, including:
Type and scale of the data (like categorical, continuous, or discrete)
Number of groups you are comparing
Sample size
Whether the data meet certain assumptions (such as normality or equal variances)
Selecting an appropriate test is a crucial first step—using the wrong one can lead to misleading conclusions
The limitations of statistical tests
Even when you choose the right test, it’s important to remember that statistical tests are based on probabilities, not certainties. Results can be affected by:
sample size
random variation
violations of test assumptions
sheer chance
This is why both false positives and false negatives can occur. A statistically significant result doesn’t necessarily mean that an effect is real, important, or meaningful. With a large enough sample size, even a tiny effect can reach statistical significance, while a genuinely important biological effect might remain undetected in a small dataset. This distinction—between statistical significance and practical significance—is crucial: statistical significance tells us that an effect is unlikely to be due to chance, whereas practical significance asks whether the effect is actually large enough to matter.
Good statistics cannot fix bad data
And while statistics can highlight patterns, they cannot fix poor-quality data. If the study design is flawed, measurements are inconsistent, or important variables weren’t controlled, even the most sophisticated test can lead to unreliable conclusions. Good data must come first—statistics simply help us interpret it.
Why context matters
So, a p-value alone should never be the final word. What really matters is the bigger picture:
How well was the study designed?
Is the data reliable?
Are the findings consistent with previous research?
Do the results make scientific sense?

Other statistical tools besides the p-value, such as confidence intervals, effect sizes, and replication, help us evaluate practical significance and understand not only whether something might be happening, but also how confident we can be in the result and how meaningful the effect truly is.
Transparency and reproducibility
Transparency and reproducibility play a key role when conducting an experiment. Clearly reporting how the data were collected, which tests were used, and how decisions were made allows others to evaluate—and repeat—the analysis. Replication strengthens confidence in results far more than any single number ever could.
Of course, in practice, replication can be difficult: limited time, funding, and resources often mean that follow-up studies are not conducted as frequently as they should be. This makes transparency even more important, because well-documented methods allow others to evaluate the work even when full replications aren’t feasible.
Crucially, statistical tests cannot replace scientific reasoning. They can suggest whether a pattern is unlikely to be due to chance, but they cannot explain why it occurred or whether it makes biological sense. That part still relies on domain knowledge, critical thinking, and understanding of the system being studied.
From data to understanding
So, we’ve seen that interpreting data is far more than reading a p-value: it requires a comprehensive approach. Reliable conclusions come from combining statistics with good study design, domain knowledge, and a bit of skepticism. Context is what turns data into understanding.
Today, information is everywhere—videos, books, online tutorials. They can offer excellent content, but easy access can blur the line between being informed and being an expert. In many fields, real expertise still grows from years of study, practice, and experience.
And the ability to interpret information isn’t just a challenge for scientists—it matters to anyone making decisions based on what they find online. Whether it’s health advice or financial tips, the accuracy of the information we choose to trust can strongly influence our everyday decisions. Popularity doesn’t equal credibility, and convenience doesn’t guarantee accuracy. In a world where opinions spread faster than facts, learning to critically evaluate sources has become an essential life skill.
Even when the sources are reliable, expertise is more than collecting facts. It’s the ability to evaluate them, apply them, and test them in real situations—understanding why something works, when it doesn’t, and how to adapt. In many fields, an expert isn’t just someone who knows a lot, but someone who truly understands what they know. When that kind of understanding is paired with thoughtful skepticism, today’s overwhelming flow of information can be turned into meaningful insight.
Science advances not through certainty, but through careful thinking, honest questioning, and the willingness to learn from evidence.

ChatGPT was used to refine the grammar and structure of the text and to suggest ways to expand and clarify the section on the limitations of statistical tests and the final chapter. All images were created by me in Canva.

Comments